Final Thesis
MEASUREMENT SYSTEM FEASIBILITY: A STUDY ON MICHELSON INTERFEROMETERS AND WEAK VALUE AMPLIFICATION
By Kristian Dolghier, Approved by Dr. Ricardo Decca, Chair of the Department of Physics
A Write-Up Submitted for the Requirements for the degree of Master of Science
May 2023
THE PURDUE UNIVERSITY GRADUATE SCHOOL
ABSTRACT
This write-up presents an in-depth analysis of weak value amplification in both Sagnac and Michelson interferometers, comparing their strengths and weaknesses. We investigate intrinsic noise within the existing experimental setup and explore the implementation of software and hardware lock-in amplifiers. Furthermore, we examine the impact of different beam diameters on sensitivity and compare various methods for measuring angular deflection to determine the optimal approach for highly sensitive measurements. This work offers valuable insights for the practical application of weak value amplification, contributing to the ongoing research in this area.
INTRODUCTION
The study of weak value amplification (WVA) in interferometry has become increasingly important in the field of physics due to its potential applications in precision measurement. In particular, the use of Michelson interferometers in conjunction with WVA has garnered significant interest in recent years, as it allows for the detection of small changes in an angle of interest with high sensitivity. Our study provides a foundation for the future development and optimization of WVA techniques in interferometry, which could have significant implications for the advancement of high-precision measurements in fields such as quantum optics and gravitational wave astronomy, including the ongoing efforts of LIGO.[1]
The practical implementation of WVA in interferometry is still a topic of active research, with several challenges that need to be addressed. In this write-up, we present a detailed analysis of the feasibility of WVA in Michelson interferometers and compare it with current functional Sagnac interferometers. Additionally, we analyzed the noise intrinsic to the physical setup and compared the implementation of a software lock-in amplifier to a hardware lock-in amplifier. Through this work, we aim to provide valuable insights into the practical application of WVA in interferometry, and its potential for applications such as measuring the gravitational constant.
In 1988, Aharonov and colleagues introduced a new method of quantum measurement called weak measurement [2]. In contrast to strong measurement, weak measurement obtains information about a quantum system by probing it weakly, which approximately preserves its initial state. The measurements in weak measurement are generally uncertain due to the weak perturbative nature of the information extraction. However, this is typically overcome by averaging over a large number of identically prepared states. One of the most interesting aspects of weak measurement is post selection, which can produce outcomes called weak values that are not eigenvalues of the measurement operator. These weak values can even exceed the eigenvalue range of typical strong or projective measurements and are often complex.
A group of researchers from the University of Rochester have employed a device that utilizes WVA to measure angular deflection, as described in a recent paper [3]. The device, called the Rochester design, is based on Sagnac interferometer geometry. In this design, a dark port plays a significant role in the measurement process. A dark port is an output port of an interferometer where no light is detected under ideal conditions. It is created when the interfering light beams destructively interfere with each other, effectively canceling each other out. In contrast, a light port is where the light beams constructively interfere, producing a strong output signal.
In the Rochester design, a path-dependent phase offset is introduced using a half-wave plate (HWP) and a Soliel-Babinet compensator (SBC). This unique configuration allows photons to exit from the dark port to produce a path-dependent transverse momentum when in-plane deflections of the target occur. When the transverse momentum resulting from the deflection is lower than the transverse momentum uncertainty, WVA can cause the beam spot at the dark port to undergo proportional displacements. The degree of amplification can be adjusted by modifying the phase offset between the two paths. A Michelson Interferometer utilizes the same concept albeit rarely utilizes an SBC for a phase offset. The following diagram from [3] demonstrates a Sagnac Interferometer.
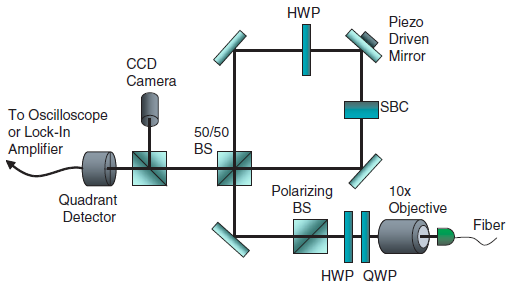
Fig 1: "The objective lens collimates a 780 nm beam. After passing through polarization optics, the beam enters a Sagnac interferometer consisting of three mirrors and a 50=50 beam splitter arranged in a square. The output port is monitored by both a quadrant detector and a CCD camera. The SBC and half-wave plate in the interferometer allow the output intensity of the interferometer to be tuned. The piezo mirror gives a small beam deflection." [3]
The operation of a Sagnac interferometer can be described as follows: a laser beam is divided into two counter-propagating paths by a beam splitter. These paths travel in opposite directions around a loop before recombining at the beam splitter. An SBC works by only introducing a phase shift to the light that first traveled through the HWP. The light that goes counterclockwise is not phase shifted and only goes through the HWP after the SBC. The target being measured is typically a piezo driven mirror whose angle is changed. This results in changes to the interference pattern and by measuring the change of the position of the beam, the small angle can be precisely determined.
A Michelson interferometer operates similarly by splitting a laser beam into two paths using a beam splitter. One path is reflected off a fixed mirror while the other is reflected off a piezo driven mirror. The two paths are then recombined at the beam splitter, and the resulting interference pattern is detected. While it is possible to introduce a phase difference using a Soliel-Babinet Compensator (SBC), the phase can also be changed by simply moving the piezo driven mirror in the plane of the laser.
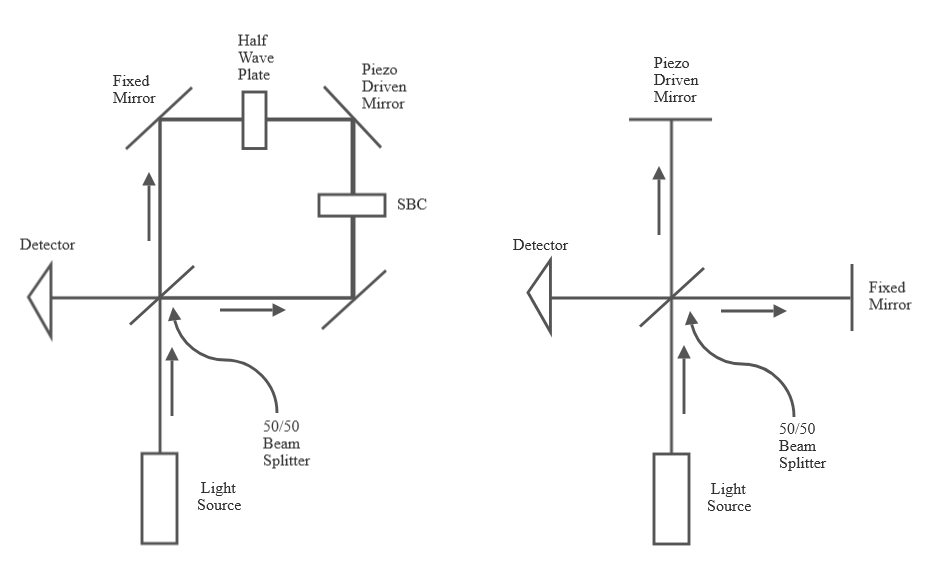
Fig 2: Illustrating the Sagnac interferometer (left) alongside the Michelson interferometer (right), showcasing the differences in their configurations.
A crucial component in these setups is the four-quadrant detector, chosen for its ability to measure both the position and intensity of the incident light beam. This detector comprises four distinct photodiodes, each responsible for detecting light in a specific quadrant of the detector's surface.
One of the main reasons for employing a four-quadrant detector is its ability to track the position of the beam with high precision. By calculating the difference in intensities between opposing quadrants, it is possible to obtain accurate information about the beam's position along the x and y axes. Specifically, the position of the beam along the x-axis can be determined by taking the difference between the sum of the intensities in the left quadrants and the sum of the intensities in the right quadrants, divided by the total intensity. Similarly, the position along the y-axis can be calculated by taking the difference between the sum of the intensities in the top quadrants and the sum of the intensities in the bottom quadrants, divided by the total intensity.
In our current setup, the position
is represented by the following equations:


where I_1 refers to the top left quadrant, I_2
refers to the top right, quadrant I_3 refers to the bottom
right quadrant, and I_4 refers to the bottom left quadrant.
Utilizing a four-quadrant detector in the interferometer setup offers several advantages. First, it enables precise measurements of the beam's position, which can be critical for aligning optical components and monitoring the stability of the interferometer. Second, it allows for simultaneous measurement of the beam's intensity, providing valuable information on the overall performance of the optical system.
Despite the potential benefits of WVA, there are limitations to the degree of amplification that can be achieved in practice. Additionally, there is a challenge of experimentally setting up such a device.
THEORETICAL WEAK VALUE CALCULATIONS
WVA works by leveraging the unique principles of quantum mechanics, particularly the pre- and post-selection of quantum states, to gain information about a quantum system without significantly disturbing its initial state. In a WVA experiment, a weak interaction is introduced between the system of interest and a measuring apparatus. This weak interaction imparts minimal disturbance to the system, thereby preserving its coherence. After the interaction, a post-selection process is applied, which can lead to amplification of the weakly measured value, known as the weak value. The weak value can sometimes be much larger than the expected eigenvalues of the measured observable, allowing for the amplification of small signals or effects.
The reason WVA works lies in the fundamental principles of quantum mechanics, where the probabilities and measurement outcomes are determined by the interference of complex-valued probability amplitudes. By carefully selecting the pre- and post-selected states, it is possible to harness the quantum interference effects in a way that emphasizes the desired signal or effect, enhancing the sensitivity of the measurement process.
WVA can enable the measurement of smaller angles than what is achievable with an autocollimator. Note that an autocollimator is an optical instrument designed for the precise measurements of small angular displacements. Autocollimators combine the functionalities of a telescope and a collimator in a single device, projecting a collimated light beam onto a reflective surface, which then reflects the beam back to the autocollimator for analysis. They are widely used in applications such as alignment and calibration of optical components, measurement of surface flatness, and verification of mechanical angles in precision engineering.
However, there is a limit to the smallest angles autocollimators can measure, determined by factors such as the accuracy of the optical components and the stability of the setup. In contrast, WVA as will be demonstrated has the potential to measure even smaller angles. This is contingent on the signal being greater than the noise and the system's stability limits. The formula for WVA is given by: [3]

Where ψ_i represents the initial quantum state of the system before the interaction, while ψ_f denotes the final quantum state after the interaction. A ̂, also known as the operator, corresponds to the observable of interest, such as position or momentum, and is used to describe the physical quantity being measured. In the context of WVA, A_w is a complex number that quantifies the amplification factor, which arises due to the weak interaction between the system and the measuring device. This expression is applicable to both Sagnac and Michelson interferometers, although they have different values for ψ_i and ψ_f. [4]
For a Sagnac interferometer, the
initial state, final state, and operator can be defined as the following:


where φ is the phase, ↺ is the counterclockwise path of light, and ↻ is the clockwise path of light [3]. The numerator can be calculated first:


And similarly for the denominator


So, this gives us a result of:

For the Michelson interferometer, the initial states differ as described in reference [5] where we define ψ_i, ψ_f, and A ̂ as:


Where H and V denote the horizontal and vertical polarization states, respectively. These states form an orthonormal basis for the polarization space, allowing any arbitrary polarization state to be represented as a linear combination of H and V. α represents the angle determining the initial state's polarization, and φ still represents the phase difference.
With the same WVA formula, we still have the following:

where in calculating the numerator, we find that:


where α represents the angle that determines the initial state's polarization. For the denominator we get:


Where for the WVA we get:

Comparing these two expressions appears to reveal that the Sagnac interferometer appears to have twice the WVA. However, it will be demonstrated that this observation does not hold true. Since φ is a very small angle, the small-angle approximation can be applied, which allows for the simplification of the expressions by removing the cot function to obtain the following:
Michelson Weak Value:

Sagnac Weak Value:

On a slightly separate note, the authors of [6] finds a similar WVA for a Sagnac interferometer of A_w=i cot(φ/2) which reduces with small angle approximation to A_w=2i/φ . The missing negative sign is just a function of a slightly different ψ_i. The authors determined the value of 〈x〉, where 〈x〉 is the expectation value of the measurement of the transverse displacement in the dark port. This is what we will be measuring as this can represent the small angular deflection we aim to assess. Note that much of the following section is taken directly from [6] albeit reinterpreted and with a different scope. The authors found the following:

where φ_i (x) is assumed to be even. Length a is defined as √(〈x^2 〉_i ) otherwise known as the input beam radius, and k is the transverse momentum due to the tilt of the mirror.
The result of Eq (1) is then modified as

where γ=ℓ_ℓm/(ℓ_ℓm+ℓ_md ) * ℓ_ℓm is defined as the length of the path from the lens to the mirror and ℓ_md is defined as the length of the path from the mirror to the detector. σ is the radius of the beam at the detector.
The amplification factor is defined as:

Through the limit of φ→0, the output power which is proportional to |⟨f│i⟩|^2=(sin(φ/2) )^2 which approaches 0. From here we can derive the amplified displacement 〈x〉 and the amplification factor A for all orders of k. Let x_l, x_m, x be the transverse displacement of the lens, mirror, and detector. We have:

also, we find that:

and by setting up the initial states we find:

where Φ_(m,i) (x_m) is the initial wavefunction at the mirror. The photons gain a transverse momentum at the mirror which is described by unitary operator e^(-ikx_m A) so we can state the following:

given a post selected state | f ⟩, we see:

Following this, one can see that A^2=1 (needed as the state is not normalized yet). Breaking apart the above calculation we find the following.

From equations 5 and 6, we find the following:

From here we find the expectation value of any moment of x: 〈x^n 〉=(σ/a_m )^n , and

Where α_±=(1± |A_w |^2 )/2 . So, from Eq (8) when n=1, we find the expectation value and with A=|〈x〉|/δ we can find the amplification factor. Right now, the weak value is imaginary as A_w=i cot(φ/2) . From Eq (8) we find the expectation value to be the following under the assumptions that |Φ_(m,i) (x_m)|^2 is an even function. So we get,

which gives the measured value form the weak value measurement for an arbitrary Φ_(m,i) (x_m). In the lowest order in k, Eq (9) gives 〈x〉=2ka_m σ cot(φ/2) which reproduces Eq (2). To maximize |〈x〉| when φ is varied we do:

Where cosφ=〈cos(2kx_m ) 〉 , so when ka_m is small we see:

So from Eq (9) and Eq (10) we see that the displacement |〈x〉| and amplification factor A are bound even when the post selected states are orthogonal. Whereas previously we showed that the 〈x〉 was proportional to the weak value. This implied that 〈x〉 diverges when φ→0 so we could get infinite amplification. But as shown in Eq (9), when φ→0,〈x〉→0. So, we cannot get infinite amplification even if the power of the beam is increased significantly. This holds true for both a Michelson and a Sagnac interferometer albeit with different initial definitions.
It is important to mention that our analysis did not consider the effects of altering the angle of one side of the Michelson interferometer when adjusting the piezo mirror. Such adjustments can result in a slightly different path length due to the change in angle. This may cause a change in the amplification observed.
EXPERIMENTAL MINIMAL RESOLUTION
Considering the aforementioned factors, we will now delve into the experimental maximum angular resolution and some of the noise constraints for autocollimators, Sagnac interferometers, and Michelson interferometers, referencing several peer-reviewed papers to support our discussion.
According to [3], the experimental minimum angular resolution for their Sagnac interferometer setup was 400 ± 200 frad. The large error bars suggest limited utility at this level of precision. However, as demonstrated in Figure 3 from [3], the error bars decrease significantly for resolutions above approximately 10^2 prad.
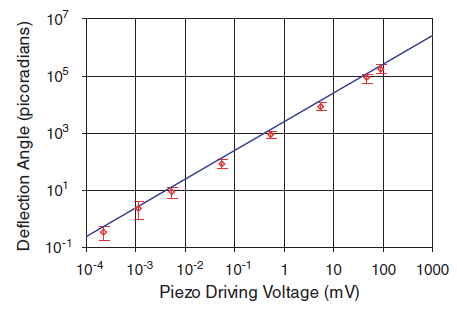
Fig 3: "Angular displacement of the mirror is plotted versus piezo driving voltage. Weak value signal amplification allows small deflections to be measured. The solid line shows the expected deflection based on an extrapolation of calibrated measurements of the piezo actuator's linear travel at higher voltages. These data were taken using a weak value amplification of approximately 86" [3]
Further noise reduction could potentially improve the resolution. As mentioned in [3] and sourced from [7], weak value measurements inherently reduce thermal, electrical, and vibrational noise by minimizing technical noise and enhancing the signal-to-noise ratio. Nevertheless, this seems to be the minimum angular resolution achievable with reasonable error bars for a Sagnac interferometer.
At the time of writing, no published articles were found that detail WVA of an angular signal in a Michelson interferometer. The LIGO project uses a Michelson interferometer to measure in-plane displacement rather than angular displacement [1]. However, if WVA is not considered, one author does investigate angular displacement within a Michelson interferometer [8]. This papers primary focus is to test the Newtonian inverse-square law or the weak equivalence principle of general relativity, with an emphasis on measurements featuring test mass separations in the sub-millimeter range.
The researchers in [8] developed a modified Michelson interferometer as an alternative method for measuring small twist angles. The main modification involved introducing two additional arms for improved angular alignment. They also developed a series of detectors and LabView software routines to determine the orientation of a mirror attached to a sinusoidally driven rotation stage. The interferometer's angular resolution was 8.1 μrad per fringe, with a dynamic range spanning 0.962 mrad. Although the minimum angular resolution is lower without WVA, this approach has some advantages, such as a smaller signal-to-noise ratio and greater control.
Autocollimators are optical instruments that are employed for the precise measurement of small angular deflections. Due to ease of use and relatively precise measurements, they are widely used in various manufacturing settings. Autocollimators operate on the principle of collimation, where a light beam is emitted from a light source, directed towards a target mirror, and then reflected back into the autocollimator. The reflected light is then analyzed to determine the angular displacement of the target mirror.
There are two primary types of autocollimators: visual and electronic. Visual autocollimators utilize an eyepiece through which an operator observes the alignment of the returning light beam, whereas electronic autocollimators make use of a photosensitive detector, such as a charge-coupled device (CCD) or a complementary metal-oxide-semiconductor (CMOS) sensor, to analyze the reflected light.
In both types of autocollimators, the light source typically consists of an LED or a filament lamp. The light emitted from the source passes through a set of slits or a reticle, which forms a specific pattern. This pattern is then collimated by a lens, resulting in a parallel light beam. The collimated light beam is directed towards the target mirror, which reflects the light back towards the autocollimator.
As the light returns to the autocollimator, it passes through the same lens used for collimation, which now focuses the light onto a photosensitive detector or an eyepiece in the case of visual autocollimators. The angular displacement of the target mirror causes the reflected pattern to shift its position on the detector or in the eyepiece. The amount of shift is proportional to the angular displacement, allowing for the precise measurement of the mirror's angle. See figure 4 to observe this.
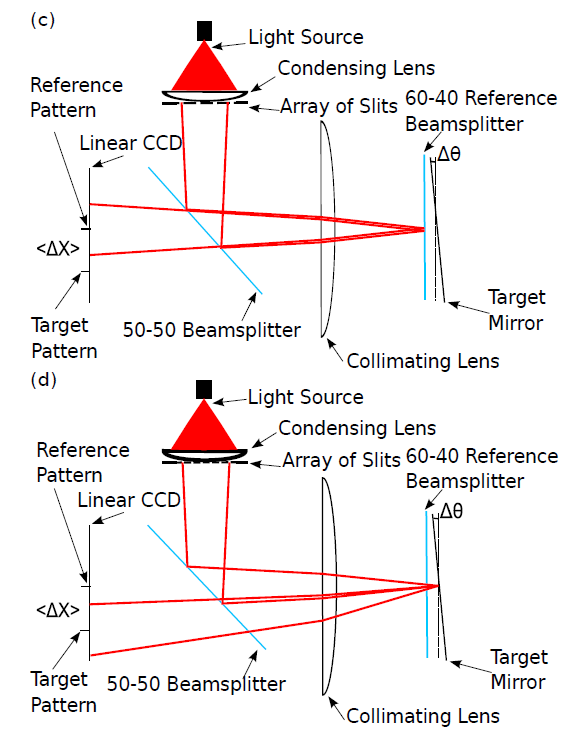
Fig 4: Taken directly from [9], "(c) Eöt-Wash multi-slit autocollimator. Reflection from reference mirror shown." (d) Eöt-Wash multi-slit autocollimator. Reflection from target mirror shown.
To enhance the accuracy of an autocollimator, several techniques can be employed. One such method is the use of a reference mirror, which allows for differential measurements. By measuring the angular displacement of both the target and reference mirrors, common noise sources can be effectively suppressed, resulting in a more accurate measurement. Additionally, incorporating a condensing lens in the system can reduce the impact of optical aberrations and increase the intensity throughput, further improving the autocollimator's performance.
Taylor Hobson produces a commercially available Ultra high Precision Digital Autocollimator. Based on the spec sheet the autocollimator's resolution, or the smallest angular change it can detect, is reported to be 0.001 arc sec [10]. Do note that this autocollimator has poor accuracy (±0.5 arc sec), but excellent precision as mentioned above. There is no mention of the uncertainty at a measurement of .001 arc sec.
The authors from [9] presents an experimental study on the noise and minimal resolution of a multi-slit autocollimator system. This autocollimator is notably sensitive to small variations in air pressure and air currents along the beam path so to mitigate these effects, the autocollimator was placed in a vacuum chamber. The results as follows led to a three-fold improvement in sensitivity at frequencies below 50 mHz compared to the best performance at atmospheric pressure.
Thermal noise was another factor considered in the experiment. The researchers found that the leading effects of temperature variation were thermal expansion of the CCD and temperature variation in the LED. By adding heat sinks to the CCD and LED, the effect of temperature variation was reduced to below the 1 prad/√Hz noise floor from 10 mHz to 1 Hz. The autocollimator demonstrated a sensitivity of approximately 1 prad/√Hz across all frequencies down to 5 mHz, where the noise began to rise with a 1/f amplitude profile.
The authors further explored the autocollimator's dynamic performance by mounting it on a beam balance apparatus. In this configuration, the autocollimator achieved a sensitivity of about 250 prad/√Hz above 50 mHz. The dynamic range of the autocollimator was measured to be 9.3 ± 0.1 mrad, with a SNR of about 107.
Combining the various sensitivities and their relative error and converting them all to radians, we get the following table.

Where the error for the 'Michelson (No WVA)' was calculated given that the noise floor is 300 nrad/√Hz and at a frequency of .1 Hz. The Custom Autocollimator error was calculated at a frequency of .1 Hz with a noise floor of 1 nrad/√Hz.
CURRENT SETUP
Physical Setup:
From the prior two sections, we can gather that Michelson Interferometers have similar amplification as compared to Sagnac interferometers. Additionally, it was made clear regarding the large difference in the minimal resolution rating for an autocollimator as compared to a interferometer utilizing WVA. Due to size constraints, we chose a Michelson interferometer setup for our purpose of measuring big G, and now we shall detail the current setup. While we will refer to our experimental setup as a Michelson interferometer, it is essential to note that it is not one in practice. Our setup is assembled using off-the-shelf components and suffers from a considerable amount of noise and instability. There is also an inability to create a dark port thus making all of our measurements strong rather than weak.
The system uses a 5 mW, 632.8 nm red helium-neon laser as the light source. The laser light is directed to a 50/50 beam splitter, which splits the beam into two equal-intensity beams traveling along orthogonal paths. One arm has a fixed mirror, while the other arm contains a piezo driven mirror for precise control. A full description is under Appendix A.
The interference pattern, created when the beams recombine at the beam splitter, is detected by a quad cell silicon photodiode. To improve the signal-to-noise ratio (SNR), we use a chopper and lock-in amplifier. A chopper controller connected to a motor spins a disk with uniform gaps in the optical path, modulating the laser beam's intensity. This modulated signal is then detected by the photodiode and converted into an electrical signal.
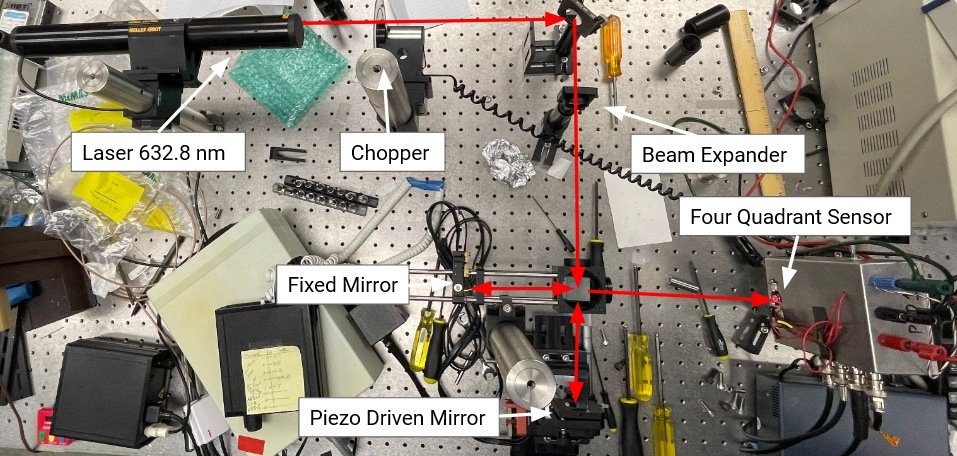
Fig 5: Current experimental setup for the Michelson interferometer.
The lock-in amplifier (not pictured above) selectively amplifies the modulated signal component while suppressing noise present at other frequencies. This technique significantly improves the SNR, allowing for more accurate and sensitive measurements of small angular deflections and associated displacements in our interferometer setup.
In our setup, a photodetector board from AFM Workshop is employed to obtain the data from the four-quadrant detector [11]. The photodetector board processes and filters the signals from the four-quadrant detector and outputs the data through a BNC connector, which is then connected to a lock-in amplifier for further analysis and processing.
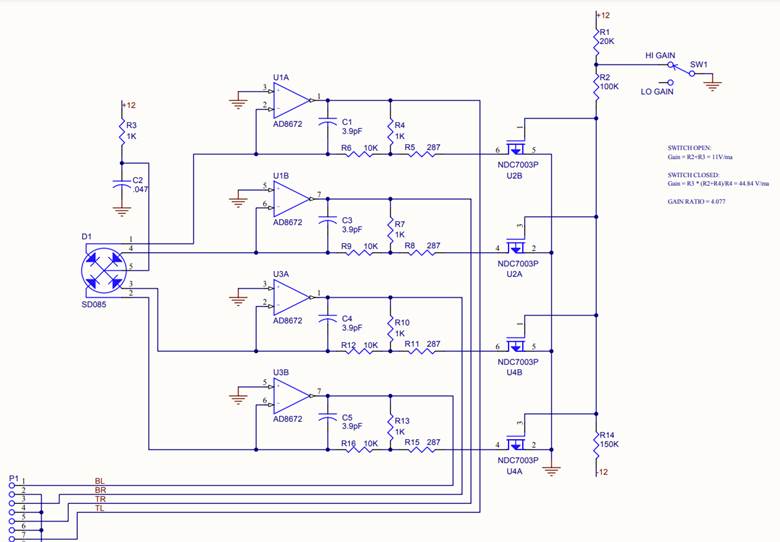
Fig 6: Circuitry of the board from the photodiode to the BNC connectors. Directly taken from [11]
In the photodetector board schematic in figure 6, the signals from the four-quadrant detector are processed to produce five outputs. The fifth output serves as a DC bias component for the four-quadrant detector signals. This biassing is made by the capacitor C2 and resistor R3 which act in concert to ensure the sensor has a linear response.
Filtering in the circuit is primarily achieved using an op-amp, capacitors, and resistors. In the case of output 1, we first have an input signal connected to the inverting (-) input of the op-amp, while the non-inverting (+) input is grounded. This configuration results in an output signal that is inverted. The capacitor creates a frequency-dependent impedance in the feedback loop. At lower frequencies, the capacitor behaves as an open circuit, while at higher frequencies, it acts as a short circuit. The 10k Ω and 1k Ω resistors in parallel in the feedback loop act as a voltage divider, which influences the gain and frequency response of the filter.
The 287 Ω resistor in series with the parallel resistors further influences the gain and frequency response of the filter. It also connects to a high gain/low gain switch that allows you to adjust the overall gain of the circuit. Under our current setup, the lower gain is desired as it produces less noise. Our circuit is an active inverting low-pass filter, and we can calculate the exact cutoff frequency using the following formula:

where R_eq is the combined resistance of the parallel resistors and the 287 Ω resistor, and C is the capacitance of the capacitor.
After the circuit, the output from the photodetector is sent through a BNC connector to a National Instruments BNC-2110 terminal block. This terminal block serves as an interface that accepts the analog signals, indexes them, and directs them to a PCI 6024E data acquisition card installed in the computer. The PCI 6024E card is capable of a maximum sampling rate of 200,000 samples per second. The photodetector output is then fed into the data acquisition system (LabVIEW) for further analysis and interpretation. Note that the output is given as a voltage but will be interchangeably referred throughout as either voltage or intensity.
The photodiode sensor comprises four quadrants, each measuring 1.6 mm by 1.6 mm. There is a small gap in the center, ranging from -0.01 to 0.01 mm. The laser beam utilized in the interferometer setup has a specified diameter at the 1/e² points of 0.80 ± 5%. The 1/e² points, also known as the beam waist, represent a common way to characterize the width of a Gaussian beam.
The term 1/e² refers to the intensity of the beam being 1/e² times the peak intensity, where e is the base of the natural logarithm, approximately equal to 2.718. The intensity at the 1/e² points is approximately 13.5% of the peak intensity. In other words, the diameter at the 1/e² points encloses an area in which the intensity of the beam is greater than or equal to 13.5% of the maximum intensity. This is a widely used measure to describe the size of the beam, as it provides a clear indication of the region where the majority of the beam's power is concentrated.
To better visualize the experimental setup and estimate the amount of light potentially lost due to the sensor gap and the 1/e² diameter, a MATLAB figure was created to visualize the Gaussian distribution of the beam. The Gaussian beam profile follows a bell-shaped curve, with the highest intensity at the center and decreasing as one moves away from the center. The diagram helps to illustrate the spatial distribution of the beam intensity and its interaction with the photodiode's quadrants, while also considering the gap in the center.

Fig 7: MATLAB simulation of a Gaussian beam distribution at a beam diameter of .59e^(-3) m, and the dimensions of the sensor mentioned previously. Note that the dashed line accurately represents the dead space in-between each quadrant.
Code Setup:
In the LabVIEW code, the channel configuration is initially set, designating channels 0 to 4 for data acquisition purposes. Channel 0 is allocated to the chopper, and channels 1 to 4 are linked to the voltage signals from each quadrant of the photodiode. Specifically, channel 1 corresponds to the top left quadrant, channel 2 to the top right quadrant, channel 3 to the bottom right quadrant, and channel 4 to the bottom left quadrant. Selective parts of the diagram from Appendix B will be employed to visualize this code.
Data acquisition is carried out using LabVIEW's "AI Voltage" and "Sample Clock" Virtual Instruments (VIs). The "AI Voltage" VI is in charge of obtaining input signals from the data acquisition card, while the "Sample Clock" VI manages the sampling rate and synchronizes the data collection process. Both VIs are placed outside the while loop. Positioning the "Sample Clock" outside the loop allows for continuous sampling, which is not feasible when placed inside the loop, as it would require finite samples. Additionally, starting and ending the task must be done outside the loop.
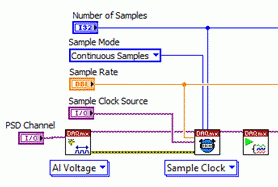
Fig 8: The initial selection of parameters outside the while loop. All of these can be selected on the front panel as they are controls.
The user needs to define the sampling rate and the number of samples to be collected. The sampling rate dictates how frequently data is collected, which should consistently be 40,000 samples per second for each of the 5 channels, as specified by the PCI card. The number of samples refers to the total count of data points collected during each cycle of the data acquisition process. In the context of this LabVIEW implementation, a cycle can be understood as a single iteration of the data collection and processing loop. Each sample represents a distinct voltage measurement from the photodiodes at a particular time. As the input is analog, the collection limit depends solely on the PCI card.
The choice of the number of samples (separate parameter from the sampling rate) has a direct impact on the resolution and accuracy of the acquired data. A higher number of samples will provide more data points within a given time frame, thus capturing a more detailed representation of the signal's behavior over time. Conversely, a lower number of samples will result in a less detailed representation, which may not fully capture the intricacies of the signal.
When combined with the sampling rate, the number of samples contributes to determining the time duration over which the software lock-in amplifier operates (i.e., the buffer time). The ratio between the rate and the number of samples defines this duration. For instance, if the sampling rate is 40k samples per second and the number of samples is set to 40k, the VI will thus collect the data over a one-second period before providing a singular output data point. This relationship between the sampling rate and the number of samples allows for precise control over the data acquisition and processing parameters, optimizing the performance of the system according to the specific requirements of the experiment.
Once the data acquisition process is initiated, the LabVIEW code also initializes the spreadsheet outside the while loop to later save the data. Within the while loop, the "Analog 1D WFM Nchan Nsamp" VI converts the acquired data into waveform format. The waveform data is then indexed to obtain separate waveforms for each channel.
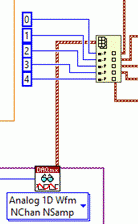
Fig 9: Conversion to waveform (red dashed line) and indexing all 5 inputs.
Subsequently, the chopper data undergoes processing to extract its frequency (f) and phase (φ) information. Sine and cosine waves, each possessing an amplitude of 1, are generated based on the extracted parameters.


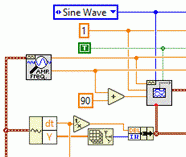
Fig 10: The chopper waveform (left dashed red line) appears from the right. The phase and frequency are taken with the "AMP FRQ" VI. The sine wave generates a sine wave, the 1 indicates the amplitude, and the red line from the bottom imports the time and amplitude from the chopper signal. The gray box on the right is what generates the waveform.
It is necessary to convert all these waveforms to arrays in order to be able to multiply the sine/cosine waves by each intensity. Following this multiplication, we perform numerical integration by applying the trapezoidal rule to the multiplied arrays. This is integrated over the buffer time (T). After performing the numerical integration, the result is divided by the buffer time ensuring a consistent value at various buffer times.

Where each value is squared, and then the square root of the sum of all of the squares is taken to obtain the Magnitude of the signal.

Finally, a clock must be defined within the while loop. The "Elapsed Time" from the clock is then used to build an array with the output signal that tracks the elapsed time since the last measurement was taken. This processed data is converted into a spreadsheet-compatible format (with '%0.9f\t' to denote 9 decimal points) and saved for further analysis. If needed, a timer function can be implemented to ensure that data points are collected at consistent intervals. This helps to avoid any variations in the time intervals between data points during the data collection process.
The implementation of Butterworth filters before the integration stage could potentially improve the performance and accuracy of the system. Butterworth filters are low-pass filters characterized by a flat frequency response within the passband and a rapid roll-off rate beyond the cut-off frequency. Using Butterworth filters would result in a cleaner, less noisy signal for further processing and integration. Moreover, the flat passband response of these filters ensures minimal distortion of the signal components within the desired frequency range, preserving the integrity of the original data.
However, in our current setup, Butterworth filters were not implemented due to the need to set the limits of the filter, which were unknown at the time. Determining the appropriate cut-off frequency and filter order is crucial for the successful application of Butterworth filters, as these parameters directly impact the filter's effectiveness in attenuating undesired frequency components. Incorrectly setting these limits could result in inadequate noise suppression or unintended distortion of the signal, negating the benefits of the filter and potentially compromising the system's performance.
HARDWARE AND SOFTWARE LOCK-IN AMPLIFICATION
As introduced in the prior section, the only reason we multiply the intensity data by the extracted sine and cosine wave is to perform lock-in amplification. The working principle of lock-in amplification is based on the concept of synchronous demodulation and phase-sensitive detection. The input signal, which is a combination of the desired signal modulated at a known frequency and noise, is multiplied by a reference signal at the same frequency. This multiplication in the time domain is equivalent to a convolution in the frequency domain, resulting in two output signals - one at the sum of the input and reference frequencies and the other at their difference. The noise, which is distributed across a broad range of frequencies, gets spread out in the frequency domain.
In the modified lock-in detection equations, the presence of even harmonics in the intensity is considered along with noise. Even harmonics are integer multiples of the fundamental frequency, where the integer is an even number (e.g., 2f, 4f, 6f, etc.). These harmonics can arise due to nonlinearities in the system, imperfections in the chopper, or other sources of distortion. These outputs are passed through a low-pass filter which will remove high-frequency components. Similar to the prior section, the general approach to lock-in amplification can be represented by the following for a physical chopper/intensity setup:


where C(t) is the chopper signal, A is the amplitude of the input signal, R is the amplitude of the reference signal, φ is the phase of the signal, θ is the phase of the chopper, and N(t) is the noise. Ideally, both θ and φ should be the same, but even if there is a slight difference, that is accounted for. When I_1 (t) and C(t) are multiplied, the output is:

Expanding this expression and using the trigonometric identity for the product of cosines:

Here, we have the product y(t) containing different frequency components: one at twice the frequency (4πft), which is an even harmonic, and the other at the difference of the two phases (φ - θ). The second term, R N(t) cos(2πft + θ), represents the noise modulated by the reference signal. The low-pass filter removes the high-frequency component (4πft), leaving behind the desired signal component and the modulated noise term. The prior equations are slightly off depending on how one desires to define them.
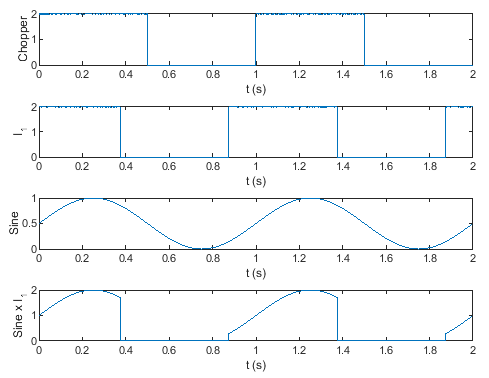
The core concept here applies to two distinct types of lock-in amplifiers: hardware-based and software-based. This analysis aims to provide a comprehensive comparison between the SR830 Lock-In Amplifier, a hardware solution, and a LabVIEW based software lock-in amplifier, both in terms of their general differences and in the context of our current experimental setup.
Hardware lock-in amplifiers, such as the SR830, consist of physical electronic components, including mixers, low-pass filters, and oscillators, which are designed to isolate and extract the desired signal [12]. In contrast, software lock-in amplifiers operate within a digital domain, where the input signal is first digitized and then processed by mathematical algorithms implemented within a software environment, such as LabVIEW [13]. The fundamental principles of operation for both types of lock-in amplifiers are the same; they multiply the input signal with a reference signal and subsequently filter the mixed signal to isolate the desired frequency component. However, the manner in which these operations are executed differs significantly.
The SR830 Lock-In Amplifier boasts a high level of performance, with dynamic reserve, low-noise characteristics, and wide frequency range. Furthermore, the device is designed for ease of integration with other instruments and optimized for use in a laboratory setting. On the other hand, a software lock-in amplifier based in LabVIEW offers greater flexibility in terms of customization, as well as scalability, and adaptability to various experimental setups. Additionally, a software-based approach can be more cost-effective, as it can leverage existing data acquisition hardware and computer resources.
In the context of an experimental setup utilizing both the SR830 Lock-In Amplifier and a LabVIEW based software lock-in amplifier, several factors should be taken into consideration. First, the performance characteristics of the hardware lock-in amplifier are likely to be superior in terms of noise reduction and dynamic reserve. However, the software-based lock-in amplifier may offer greater ease in adjusting filtering parameters, allowing for the fine-tuning of the signal extraction process. Moreover, the software lock-in amplifier can be seamlessly integrated into a larger LabVIEW-based data acquisition and processing system, facilitating real-time monitoring and control of the experiment.
For our analysis, we analyzed the difference between a software and hardware lock-in amplifier within LabVIEW for Quadrant 1 using a GPIB VI sourced from [14]. This was not in an interferometer setup, but instead just the sensor and the beam as to not consider the high noise and fluctuations of the Michelson interferometer in its current setup. The diagram is within Appendix C. The data acquisition VI should be within the while loop whilst keeping the parameters to choose from outside we can run both VIs simultaneously. The following two figures represent this data collection.
In the subsequent figures, the x-axis represents a multiple of the period rather than a specific time value. This approach was adopted because the buffer times vary at different frequencies; however, they all correspond to the same multiple of the period. To calculate this multiple, divide the number of samples by the sampling rate. For example, with 10,000 samples, the buffer time is 0.25 seconds, while with 40,000 samples, it is 1 second.
In this experiment, at a frequency of 760 Hz, the period is calculated to be 0.0013157 seconds. Therefore, with a multiple of 100 times the period, the buffer time is 0.13157 seconds. This representation allows for a more generalized analysis of the system's behavior and performance across varying frequencies, while maintaining a clear relationship to the underlying periodic nature of the signal. For the graphs, we will use 𝛕 to represent the amount times the period.
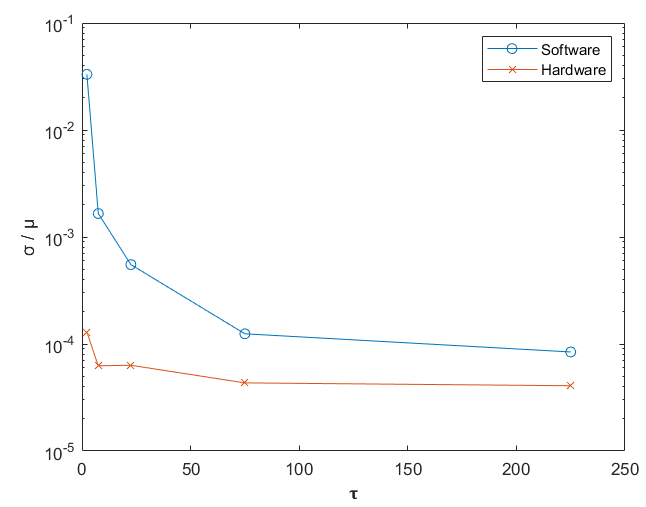
Fig 12: Using a waveform generator, a square wave with an amplitude of approximately 20mV and a frequency of 750 Hz was simultaneously fed into the two different amplifiers for a duration of 5 minutes at each data point. The y-axis represents the standard deviation divided by the mean, displayed on a logarithmic scale.𝛕 represent the amount times the period. The experiment was conducted across various buffer times and time constants. The hardware lock-in amplifier offers a selection of specific time constants: 1ms, 3ms, 10ms, 30ms, 100ms, 1s, etc. Therefore, the software buffer time was adjusted to match these exact time constants for a consistent comparison.
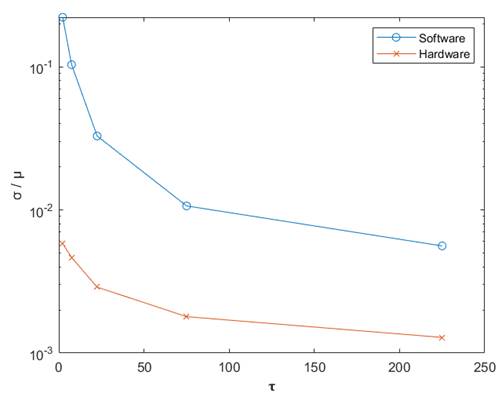
Fig 13: This figure follows the same procedure as Figure 12. However, instead of using a waveform generator, the intensity from quadrant 1 was processed. It is important to note that the initial intensity value was around 10V, which exceeds the hardware amplifier's maximum input (1V). Consequently, an ND30A filter was utilized to reduce the intensity to approximately 15mV.
In the collected data, the results demonstrate that as buffer time increases, the standard deviation decreases. Additionally, due to diminishing returns, a buffer time of 20-30 times the period is generally sufficient for testing purposes, as it provides a relatively acceptable level of error as compared to the lower buffer times. If a lower deviation or fewer data points are desired, then increasing the buffer time to 100 times the period or beyond may yield a marginal improvement.
From this data, we also extracted the ratio of the standard deviations divided by the mean for the two amplifiers. This is displayed in figure 14 and figure 15.

Fig 14: Same initial conditions as Figure 12. The Y axis is the ratio of hardware over software lock-in amplifier (standard deviation over the mean) for the waveform generated signal.
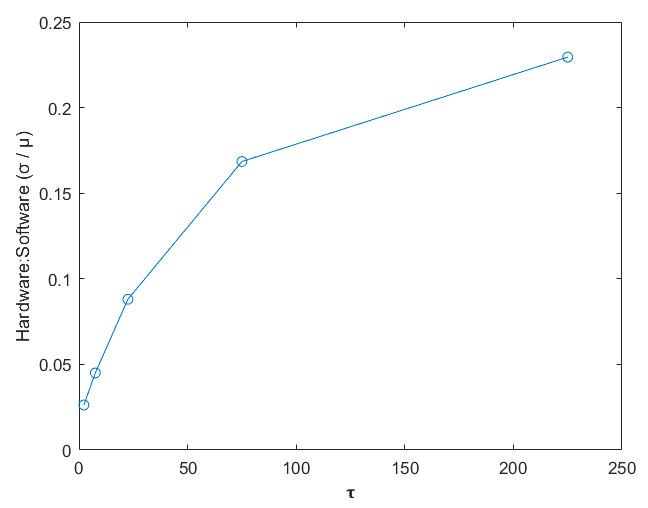
Fig 15: Same initial conditions as Figure 13. The Y axis is the ratio of hardware over software lock-in amplifier (standard deviation over the mean) for quadrant 1.
Figure 14 and 15 represent the performance of the software lock-in amplifier as compared to the hardware lock-in amplifier. Because these values are less than 1, this implies that the hardware amplifier performs better than the software amplifier. A coefficient of 1 would imply that the performance of each amplifier is identical from a noise perspective. Also, ideally the output from both types of lock-in amplifiers should differ by a constant factor, such as the square root of 2 or another predetermined value, as long as they are processing the same input signal.
The difference in performance between the two amplifiers when processing real data compared to waveform data can be attributed to several factors. Real-world signals from the sensor/beam are subject to various noise sources and imperfections that the waveform data may not experience. This can lead to higher noise levels and reduced SNR, affecting the performance of the software lock-in amplifier. In contrast, hardware-based lock-in amplifiers may be more robust against such noise sources and provide a more stable output. [15]
Software-based lock-in amplifiers are also particularly sensitive to the choice of sampling rate, as they rely on digital signal processing. If the sampling rate is not sufficiently high, aliasing can occur, introducing errors and distortions in the output signal. This issue is less prominent in hardware-based lock-in amplifiers, which often use continuous-time signal processing techniques. Data has not yet been collected on the effects of sampling rate on error as our experiment is always running at the highest possible rate as defined by the specifications.
Also, hardware-based lock-in amplifiers may suffer from nonlinearity and imperfections in their analog components, such as resistors, capacitors, and operational amplifiers. These imperfections can introduce errors in the output signal not present in software-based lock-in amplifiers, which rely on digital signal processing algorithms.
Both hardware-based and software-based lock-in amplifiers require careful calibration to ensure accurate and reliable results. Differences in calibration procedures or inaccuracies in the calibration process can cause discrepancies in the output signals, leading to deviations from the expected constant factor relationship. No filters are utilized in the software lock-in, but there is some filtering in the Hardware Lock-in as a function of the sensitivity setting.
Related to this, we have observed that larger buffer times result in lower levels of error. An alternative way of increasing the buffer time multiple is by spinning the chopper at a faster frequency. By doing so, we can run several hundred times the period faster and wait less time for our data.
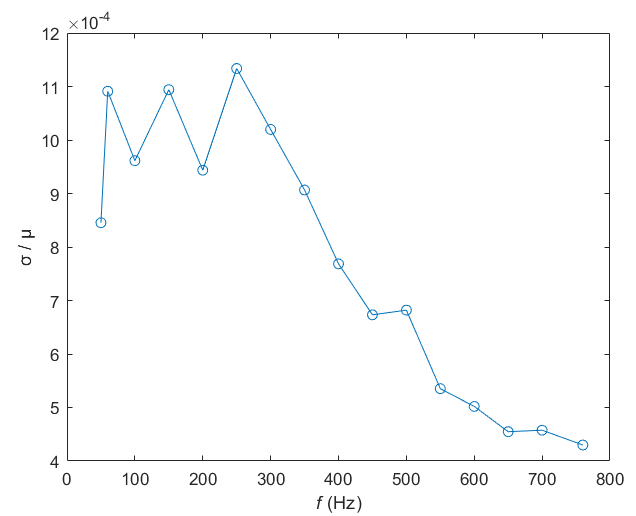
Fig 16: In this figure, we varied the chopper frequency from 50 to 760 Hz at a constant buffer time of 4 seconds (arbitrarily large compared to the minimum frequency) and ran the test for 7 minutes at each data point. This is for the sum of all 4 quadrants.
As observed in the data, there is a steady decrease in the standard deviation when the chopper frequency surpasses 300 Hz. This decline suggests that the performance of the software lock-in amplifier improves as the chopper frequency increases. Therefore, it is advisable to operate the experiment at the highest feasible chopper frequency to minimize the standard deviation, leading to more precise measurements.
NOISE CHARACTERIZATION
WVA's effectiveness relies heavily on the signal-to-noise ratio (SNR). If the SNR is too low, the accuracy of the signal will be compromised. As mentioned in the previous section, lock-in amplifiers, while enhancing the SNR, also introduce some noise themselves. This analysis will explore these noise sources and others within the system, examining their origins and potential impacts. It is important to note, that this is just characterizing the noise with the laser beam straight on hitting the sensor; this is not for an interferometer setup.
Before we can calculate the noise, it is essential to determine the equivalent resistance (R_eq) of the circuit mentioned earlier. By sending the beam into the sensor, we can measure the voltage of each quadrant. Gathering the voltage (V) three separate times over slightly different laser positions, we can find the average of the sum of the 4 quadrants voltage to be 23.38 V. The specifications of the laser state that the power (P) is 5.0 mW. Now we find:

This is the resistance of all 4 quadrants assuming that the noise contributions from each quadrant are correlated and equal in magnitude.
Furthermore, there are various sources of noise related to the photodetector. Quantum efficiency refers to the ratio of the number of electron-hole pairs generated to the number of incident photons. In practice, photodiodes do not have a perfect quantum efficiency, meaning that not every incident photon will generate an electron-hole pair and contribute to the photocurrent [18]. This imperfect conversion of photons to electrical current can introduce additional noise and uncertainties in the system.
There is also the photodiodes' responsivity (R), which refers to the output current generated per incident optical power, and can vary across the active area of the device and with wavelength. This spatial and spectral non-uniformity can introduce errors in the measured photocurrent and contribute to the overall noise in the system [19]. This is given at 0.36 A/W at 632.8 nm (based on typical value on data sheet). Also, for a quad cell photodiode, where multiple photodiode elements are arranged in close proximity, crosstalk can occur due to the diffusion of charge carriers between neighboring elements. This can lead to a mixing of signals from different photodiode elements, adding noise and reducing the accuracy of the measured photocurrent [20]. However, for our case the photodiode only gives us the noise equivalent power (NEP).
NEP is an essential parameter for evaluating the sensitivity and noise performance of photodetectors or optoelectronic detection systems. It denotes the minimum optical power that a photodetector can distinguish, with a SNR of 1, taking into account all the intrinsic noise sources in the system [21]. The NEP is given as 2.5×10^(-14) W/√Hz at V_R=0V and λ_P=950 nm per the specifications. To calculate the voltage NEP noise (N_NEP) , we can use the following formula where the bandwidth (B) is defined as the reciprocal of the time over which the experiment was run.


With an arbitrary bandwidth of 1 Hz.
Laser noise arises from various factors that contribute to fluctuations in a laser's output power and emission wavelength. The two main components of laser noise are intensity noise and frequency noise. Intensity noise is associated with fluctuations in the laser's output power and can be attributed to spontaneous emission, quantum noise, and technical noise sources such as variations in the pump source. Frequency noise is related to changes in the laser's emission wavelength, which can be induced by thermal, mechanical, or electrical perturbations affecting the laser cavity.
To assess the impact of laser noise on our measurements, we examine the amplitude noise of the laser, which is given as < 2.8% (peak-to-peak) in the 30 Hz to 30 MHz range for our laser. This value represents the combined contribution of both intensity and frequency noise components over the specified frequency range.
Considering the frequency-dependent nature of the laser noise, we can calculate the voltage noise (N_laser) at a given frequency (f) using the following formula:

By applying this formula, we can estimate the voltage noise of the He-Ne laser at different frequencies, taking into account the frequency-dependent contributions from both intensity and frequency noise components.
In addition to laser noise, the nature of photons can introduce noise into the system, specifically in the form of shot noise. Shot noise is a fundamental source of noise arising from the discrete nature of photons, leading to fluctuations in the photocurrent generated by the photodetector [16]. This noise source is inherent to the interferometer and cannot be eliminated. However, its impact can be mitigated by increasing the signal intensity, which in turn improves the SNR. Shot noise (N_s): N_s = √(2 q I B) , where q is the elementary charge (1.6×10^(-19) C), and I is the photocurrent [16].
The average photocurrent can be calculated as follows:

For a bandwidth of an arbitrary 1 Hz, the shot noise is:

The N_S noise can be found by:

Additionally, electronic components, such as resistors and operational amplifiers (op-amps), can contribute noise to the system. In resistors, thermal noise, also known as Johnson-Nyquist noise, is generated by the random motion of charge carriers within the material [15]. This noise can be modeled as a voltage noise source in series with the resistor. We can calculate the thermal noise of the circuit (N_t): N_t = R_eq √(4 k T B / R_eq ) where k is Boltzmann's constant (1.38 × 10^(-23) J/K), and T is the temperature in Kelvin (assumed to be 298 K for room temperature). Thus, the thermal noise is:

In op-amps, various internal mechanisms contribute to noise, including thermal noise in the input transistors, flicker (1/f) noise, and shot noise [17]. We can also now calculate the noise contributions from the op-amp. The voltage noise density (e_n) of the op-amp is given as 2.8 nV/√Hz. To calculate the total op-amp noise, we need to multiply the noise density by the square root of the bandwidth. We multiply by 4 for the 4 op-amps in the circuit.

Mechanical noise can also be introduced to the system due to the table's movement or a non-ideal mounting system. These vibrations can cause misalignments or shifts in the optical components, impacting the interference pattern's stability. To mitigate this issue, it is essential to implement vibration isolation techniques and carefully design the mounting system to minimize mechanical noise.
Lastly, the implementation of the software lock-in amplifier can introduce noise during the analog-to-digital conversion process and numerical integration. Limited sampling rates can cause aliasing, which occurs when high-frequency components are folded back into the frequency range of interest. To prevent aliasing, an anti-aliasing filter should be employed before digitization. Furthermore, the use of the trapezoidal rule for numerical integration can introduce errors due to the approximation of the underlying function. This has already been calculated in the prior section.
Given the various noise sources, we can now plot the voltage noise (V_N) against various bandwidths (B). We will consider the, noise current due to NEP (N_NEP), noise current due to the laser (N_laser), shot noise (N_s), thermal noise (N_t), op-amp noise (N_opamp), and the lock-in amplifier noise for the software/hardware lock-in amplifier (N_software,N_hardware).
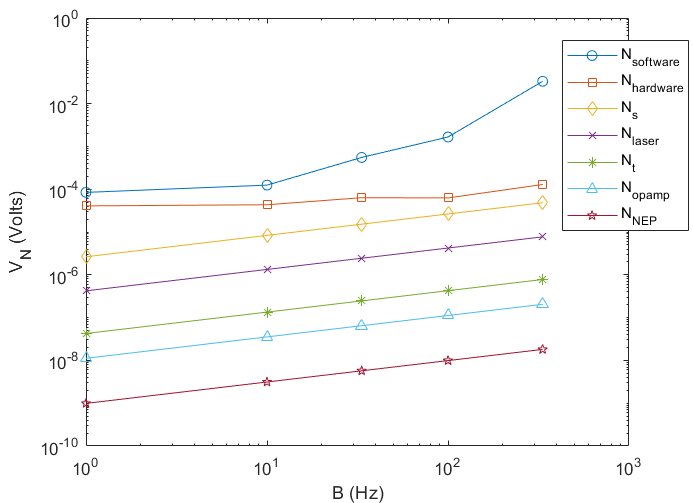
Fig 17: A graphical representation in a loglog scale of the various types of noises versus the bandwidth. Note that the bandwidth is only over which the noise of the software/hardware lock-in amplifier was run for. Also, the amplifier noise was selected for the waveform generator as to not include the noise from the sensor/laser.
This graph reveals that laser noise is the prevailing noise source, which is quite intriguing since He-Ne lasers are generally known for their stability. Nevertheless, this analysis was conducted under the worst-case scenario of power fluctuations, suggesting that the actual laser noise might be significantly lower. The software and hardware lock-in data results are not very surprising. It is remarkable that even when data is collected at a small multiple of the period, our error remains lower than the laser error. The shot noise is also quite high and since it is intrinsic, to enhance the SNR, we should reduce the bandwidth as much as possible. The remaining noise calculations are relatively low and, in reality, may always be included as part of the N_S noise calculation since we convert the noise current to noise voltage.
However, a crucial factor not considered is the noise attributed to the system's instability. By using long-term data, we can minimize the noise of other components and attempt to isolate the system noise that would encompass thermal fluctuations, air currents, vibrations, and other factors such as resonant frequencies. To mitigate noise, one should first characterize the system's stability and then try to decrease the noise according to their relative magnitudes.
Sensitivity and beam diameter
A smaller beam diameter can lead to increased sensitivity, which is important for obtaining more accurate and precise measurements. To support this claim, a MATLAB simulation was performed to investigate the intensity distribution for different beam diameters.
The Gaussian beam profile is characterized by its amplitude, which follows a bell-shaped curve with the highest value at the center of the beam and decreasing as one moves away from the center. The intensity of the Gaussian beam is the square of its amplitude. The simulation calculates the intensity in each quadrant of the photodiode for different beam diameters while considering the Gaussian profile of the beam.
The intensity of a Gaussian beam is represented as:

where A_0 is the peak intensity, r is the radial distance from the center of the beam, U is the amplitude of the Gaussian beam, and ω_0 is the beam waist radius (which is related to the diameter at the 1/e² points)[22]. In this case, the intensity is calculated for each quadrant of the photodiode, considering the beam diameter and the sensor size.
To calculate the intensity for each quadrant, we can integrate the intensity over the area of each quadrant. For example, to calculate the intensity I_1 in the bottom-left quadrant where x < 0 and y > 0, we integrate the intensity over the region where -W < y < 0 and 0 < x < W where W is equal to both the width and height of each quadrant of the square sensor.
We can express the Gaussians in terms of the position of the beam centroid X and the displacement x_0 by which the beam is shifted in the x axis. Using the error function erf(x), we can rewrite the intensity I_1 as:


Where erf(x) =2/√π ∫x 0 e^(-t^2 ) dt is the error function.
Similarly, we can rewrite the other intensities as:
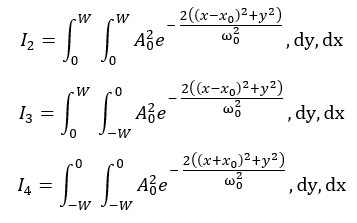
So, substituting these expressions into the formula for the slope of , we get:

Whereas we find the following:

and similarly for the following:

therefore, the expression for is:

where again, x_0 is moving the beam by a certain fixed amount of distance in the x axis. Dividing the X position by x_0 allows us to find the slope of the intensity distribution X/x_0, which is essential for understanding the response of the quadrant photodiode to the beam displacement. This slope indicates how sensitive the photodiode is to changes in the beam's position and is thus critical for evaluating the performance of the system. We find that:

This final equation can be plotted in MATLAB while looping over various beam diameters and keeping all others constant resulting in the following graph.
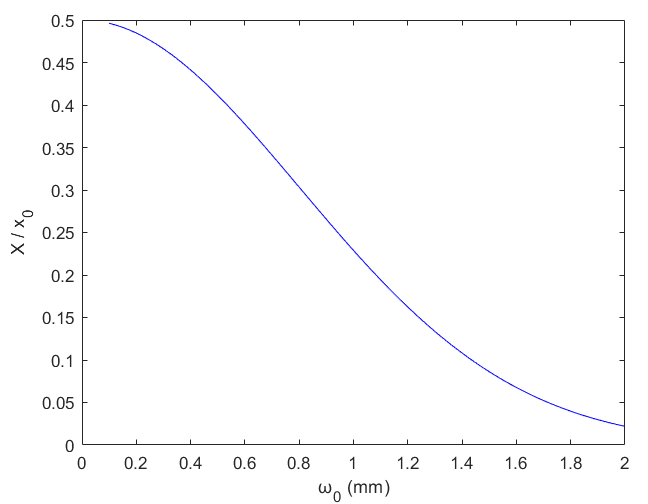
Fig 18: This MATLAB figure represents the sensitivity versus various beam diameters from .1 to 2 mm in 100 steps. This is for a given sensor size of 1.6 mm with 4 quadrants, with x_0 equaling .1mm.
In addition to sensitivity, the dynamic range of the quadrant photodiode is crucial for evaluating the performance of the system. A high dynamic range allows the photodiode to accurately detect a wide range of intensities, enabling it to measure signals without distortion or loss of information. As the beam diameter decreases and the intensity distribution becomes more concentrated near the center, the dynamic range becomes increasingly important. This is because a higher sensitivity may lead to more significant intensity differences between the quadrants, which can result in saturation or distortion if the dynamic range is limited.
To calculate the dynamic range of a photodiode, one must first determine the maximum photocurrent and the noise floor. The maximum photocurrent can be found by multiplying the photodiode's responsivity by the maximum incident light power, while the noise floor can be obtained by considering factors like dark current, shot noise, and thermal noise. The dynamic range is then calculated as the ratio of the maximum photocurrent to the noise floor. A high dynamic range is essential for accurately detecting a wide range of signal intensities without distortion or loss of information.
In our photodiodes case, we are given the maximum reverse voltage (V_max) of 50 V and the shunt resistance (R_shunt) with a minimum value of 350 MΩ, we can use Ohm's Law to estimate the maximum photocurrent:

Now that we have the estimated maximum photocurrent, we can calculate the dynamic range, which is the ratio of the maximum signal to the NEP. From the datasheet, the NEP is 2.5×10⁻¹⁴ 𝑊/√𝐻𝑧 at 950 𝑛𝑚. To convert the maximum photocurrent to the maximum optical power, we can use the responsivity at 900 𝑛𝑚 (closest to 950 𝑛𝑚), which is 0.55 𝐴/𝑊:

Finally, we can calculate the dynamic range as:

This indicates that the photodiode is capable of handling a wide range of signal intensities without distortion. Since the dynamic range is so high, the sensor is likely to perform well even when there are significant variations in the signal. But since our experimental setup ensures that the signal intensities experience only minor fluctuations, then the dynamic range becomes much less critical.
CONCLUSION
My analysis indicates that there is no theoretical difference in the amplification capabilities of a Sagnac and a Michelson Interferometer. While no experiments have been conducted using WVA to measure the angular difference of a system in a Michelson Interferometer, there should be no concerns about discrepancies between this method and the Sagnac Interferometer.
For applications requiring the utmost sensitivity, WVA is necessary since autocollimators may not provide adequate sensitivity. Prior experiments in the literature have demonstrated the superiority of WVA in this regard. However, it is crucial to carefully consider and manage noise when performing WVA, as it can significantly impact measurement accuracy.
System stability is one of the most critical factors affecting noise, and efforts should be made to characterize and evaluate potential improvements in this area. For instance, ensuring that the experimental setup is well-controlled and minimizing external factors such as ambient light and temperature fluctuations can help maintain a stable SNR. Moreover, reducing the beam size can lead to higher sensitivity, which is essential for achieving the most accurate angular measurements possible.
This write-up also provides a rigorous analysis of various methods for angular measurements, highlighting the advantages and limitations of WVA in interferometry. By comparing the performance of different interferometers and autocollimators, it establishes a clear understanding of the optimal techniques for achieving the highest possible resolution in angular measurements. By carefully considering the specific requirements of each application and the factors that can impact the performance of the chosen measurement technique, researchers can work towards the continued improvement of precision measurement in their respective fields.
APPENDIX A
Full description of experimental setup:
The interferometer consists of a 5 mW, 632.8 nm red helium-neon laser (Model: 05-LHP-151) as the light source. The laser light is directed towards a 50/50 beam splitter, which splits the incoming beam into two equal-intensity beams traveling along orthogonal paths. On one arm of the interferometer, a fixed mirror is placed to reflect the light back towards the beam splitter. On the other arm, a piezo-driven mirror (on a Newport New Focus 8082 Motorized Tilt Aligner stage) is installed to enable precise control of the path length and angle. The two beams, reflected by the mirrors, recombine at the beam splitter, and create an interference pattern. This pattern is detected by a red-enhanced quad cell silicon photodiode (Model: SD 085-23-21-021), which converts the optical signal into an electrical signal.
To enhance the signal-to-noise ratio (SNR) in our experimental setup, we employ a chopper and a lock-in amplifier. We use a Stanford Research Systems Inc. Model SR540 chopper controller connected to a motor that spins a disk with uniform gaps. This disk is placed in the optical path before the beam splitter to modulate the laser beam's intensity. This chopper operates within a frequency range of approximately 5 Hz to 760 Hz, allowing us to select an appropriate chopping frequency for our experiment.
APPENDIX B/C EXCLUDED
REFERENCES
[1] Jung, Sunghoon, and Chang Sub Shin. "Gravitational-Wave Fringes at LIGO: Detecting Compact Dark Matter by Gravitational Lensing." Physical Review Letters, vol. 122, no. 4, 2019, https://doi.org/10.1103/physrevlett.122.041103
[2] Aharonov, Yakir, et al. "How the Result of a Measurement of a Component of the Spin of a Spin-1/2Particle Can Turn out to Be 100." Physical Review Letters, vol. 60, no. 14, 1988, pp. 1351–1354., https://doi.org/10.1103/physrevlett.60.1351.
[3] Dixon, P. Ben, et al. "Ultrasensitive Beam Deflection Measurement via Interferometric Weak Value Amplification." Physical Review Letters, vol. 102, no. 17, 2009, https://doi.org/10.1103/physrevlett.102.173601.
[4] Huang, Jing-Hui, et al. "Modified Weak-Value-Amplification Technique for Measuring a Mirror's Velocity Based on the Vernier Effect." Physical Review A, vol. 105, no. 1, 2022, https://doi.org/10.1103/physreva.105.013718.
[5] Huang, Jing-Hui, et al. "Improving the Precision of Weak-Value-Amplification with Two Cascaded Michelson Interferometers Based on Vernier-Effect." ArXiv.org, 30 July 2021, https://arxiv.org/abs/2107.14395.
[6] Koike, Tatsuhiko, and Saki Tanaka. "Limits on Amplification by Aharonov-Albert-Vaidman Weak Measurement." Physical Review A, vol. 84, no. 6, 2011, https://doi.org/10.1103/physreva.84.062106.
[7] Hosten, Onur, and Paul Kwiat. "Observation of the Spin Hall Effect of Light via Weak Measurements." Science, vol. 319, no. 5864, 2008, pp. 787–790., https://doi.org/10.1126/science.1152697.
[8] LeDesma, C. K., et al. "A Modified Michelson Interferometer to Measure Sub-Milliradian Changes in Angle." AIP Advances, vol. 12, no. 8, 2022, p. 085002., https://doi.org/10.1063/5.0100720.
[9] Arp, T. B., et al. "A Reference-Beam Autocollimator with Nanoradian Sensitivity from Mhz to Khz and Dynamic Range of 107." Review of Scientific Instruments, vol. 84, no. 9, 2013, p. 095007., https://doi.org/10.1063/1.4821653.
[10] "Ultra High Precision Dual Axis Digital Autocollimator." Ametek Taylor Hobson - Metrology Experts - Precision Metrology Equipment Manufacturer, https://www.taylor-hobson.com/products/alignment-level/autocollimators/ultra-high%20precision-dual-axis-digital-autocollimator.
[11] AFM Workshop. (n.d.). AFM Workshop: Home. Retrieved from [URL not found].
[12] Stanford Research Systems. (2021). SR830 DSP Lock-In Amplifier. Retrieved from https://www.thinksrs.com/products/sr810830.html.
[13] National Instruments. (2021). LabVIEW. Retrieved from https://www.ni.com/en-us/shop/labview.html.
[14] "Stanford Research 830 Amplifier." Stanford Research 830 Amplifier - IEEE 488.2 (GPIB) Driver for LabVIEW - National Instruments, 7 Dec. 2006, https://sine.ni.com/apps/utf8/niid_web_display.download_page?p_id_guid=240C113D3165071BE0440003BA7CCD71.
[15] Owen, Tony. "The Art of Electronics (2nd Edition), by Paul Horowitz and Winfield Hill Cambridge University Press, Cambridge, 1990 https://doi.org/10.1017/s0263574700010717.
[16] Mandel, Leonard, and Emil Wolf. "Optical Coherence and Quantum Optics." 1995, https://doi.org/10.1017/cbo9781139644105.
[17] Motchenbacher, C. D., and F. C. Fitchen. Low-Noise Electronic Design. J. Wiley, 1973.
[18] Saleh, Bahaa E., et al. "Fundamentals of Photonics, Second Edition." Journal of Biomedical Optics, vol. 13, no. 4, 2008, p. 049901., https://doi.org/10.1117/1.2976006.
[19] Sze, S.M., and Kwok K. Ng. "Physics of Semiconductor Devices." 2006, https://doi.org/10.1002/0470068329.
[20] Razavi, Behzad. Design of Analog CMOS Integrated Circuits. McGraw-Hill Education, 2017.
[21] Richards, P. L. "Bolometers for Infrared and Millimeter Waves." Journal of Applied Physics, vol. 76, no. 1, 1994, pp. 1–24., https://doi.org/10.1063/1.357128.
[22] Svelto, Orazio. "Principles of Lasers." 2010, https://doi.org/10.1007/978-1-4419-1302-9.